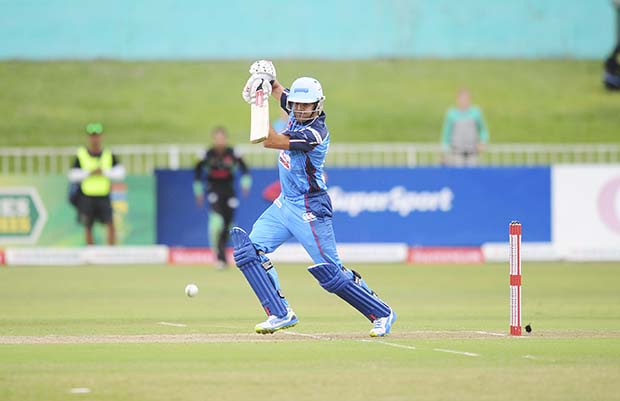
Jacques Rudolph scored his second century of the Royal London One-Day Cup to jump up to the top of the run-scoring leaderboard, reports Gareth Stevens.
The County Championship has taken a backseat with the limited overs competition in the spotlight. As a result, the stats for the longer format are unchanged, but there has been some movement on the 50-over tables.
The standout performer is unquestionably Rudolph, whose presence at the top of Glamorgan’s order has made the Welsh side a formidable unit. In a format all about runs, there are a further six South Africans averaging above 40.
Below are all the statistics of the Saffas playing First-class cricket in England, followed by a similar list that covers List-A performances. The number next to the player’s name is the position on the leading run-scorers and wicket-takers list for their respective leagues. This gives an indication of how they have fared compared to everybody else. If there is no number then they are not currently in the top 50.
County Championship:
Batsmen:
Division 1:
4)Dawid Malan: 11 matches. 903 runs. Highest score: 154 not out. Average: 50.16. Strike rate: 51.92
8)Ashwell Prince: 12 matches. 822 runs. Highest score: 257 not out. Average: 41.10. Strike rate: 55.05
21)Alviro Petersen: 11 matches. 605 runs. Highest score: 155. Average: 40.33. Strike rate: 54.35
23)Keaton Jennings: 12 matches. 603 runs. Highest score: 103. Average: 31.73. Strike rate: 38.60
36)Andrew Hall: 11 matches. 486 runs. Highest score: 75. Average: 25.57. Strike rate: 46.50
Richard Levi: 4 matches. 184 runs. Highest score: 64. Average: 26.28. Strike rate: 63.01
Hashim Amla: 4 matches. 118 runs. Highest score: 71. Average: 29.50. Strike rate: 71.95
Colin Ingram: 1 match. 51 runs. Highest score: 37. Average: 25.5. Strike rate: 45.13
Division 2:
8) Wayne Madsen: 13 matches. 750 runs. Highest score: 111 not out. Average: 37.50. Strike rate: 44.06
9) Jacques Rudolph: 11 matches. 742 runs. Highest score: 139. Average: 39.05. Strike rate: 50.61
Graeme Smith: 5 matches. 363 runs. Highest score: 103. Average: 32.87. Strike rate: 63.83
Tim Groenewald: 7 matches. 186 runs. Highest score: 56 not out. Average: 26.57. Strike rate: 67.88
Bowlers:
Division 1:
6) Alfonso Thomas: 11 matches. 357.3 overs. 44 wickets. Best bowling: 5-40. Average: 21.75. Strike rate: 48.7
21) Andrew Hall: 11 matches. 324.1 overs. 29 wickets. Best bowling: 4-77. Average: 37.03. Strike rate: 67.0
Division 2:
9) Kyle Abbott: 9 matches. 251 overs. 36 wickets. Best bowling: 5-44. Average: 20.33. Strike rate: 41.8
39) Tim Groenewald: 7 matches. 174 overs. 22 wickets. Best bowling: 5-27. Average: 23.31. Strike rate: 47.4
Royal London One-Day Cup:
Batsmen:
1) Jacques Rudolph: 7 matches. 406 runs. Highest score: 111. Average: 58.0. Strike rate: 75.88
6) Wayne Madsen: 6 matches. 320 runs. Highest score: 138. Average: 80.0. Strike rate: 105.26
11) Colin Ingram: 7 matches. 298 runs. Highest score: 72. Average: 42.57. Strike rate: 81.42
31) Keaton Jennings: 7 matches. 222 runs. Highest score: 70. Average: 55.5. Strike rate: 87.4
35)Richard Levi: 6 matches. 207 runs. Highest score: 68. Average: 41.4. Strike rate: 105.07
Tim Groenewald: 7 matches. 151 runs. Highest score: 57. Average: 75.5. Strike rate: 160.63
Dawid Malan: 7 matches. 142 runs. Highest score: 82. Average: 23.66. Strike rate: 68.93
Ashwell Prince: 5 matches. 168 runs. Highest score: 69. Average: 33.6. Strike rate: 81.15
Andrew Hall: 3 matches. 52 runs. Highest score: 43. Average: 52.0. Strike rate: 140.54
Bowlers:
22)Tim Groenewald: 7 matches. 60 overs. 10 wickets. Best bowling: 3-37. Average: 35.3. Economy: 5.88
33)Alfonso Thomas: 7 matches. 62 overs. 8 wickets. Best bowling: 3-30. Average: 51.12. Economy: 6.59
Andrew Hall: 3 matches. 20 overs. 4 wickets. Best bowling: 3-39. Average: 30.0. Economy: 6.0
Photo: Sabelo Mngoma/Backpagepix


